
Foreclosure Auction Volume Increases 23% to Match a Six-Year High in Q2 2026
FHA-insured mortgages and recent-vintage mortgages led a broad-based rise.
July 28, 2026
KEY POINTS
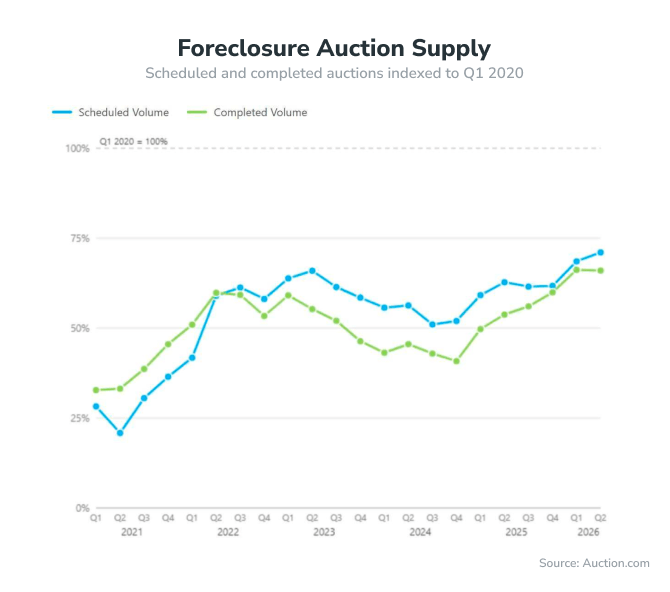
- Completed foreclosure auctions were at 66% of Q1 2020 levels in Q2 2026, unchanged from the previous quarter and up 23% year-over-year.
- Foreclosure auction volume on FHA-insured mortgages up 47%, volume on 2022 and later loan vintages up 104%.
- REO auction volume reached 48% of Q1 2020 levels, down 3% from Q1 2026 but up 11% year-over-year.
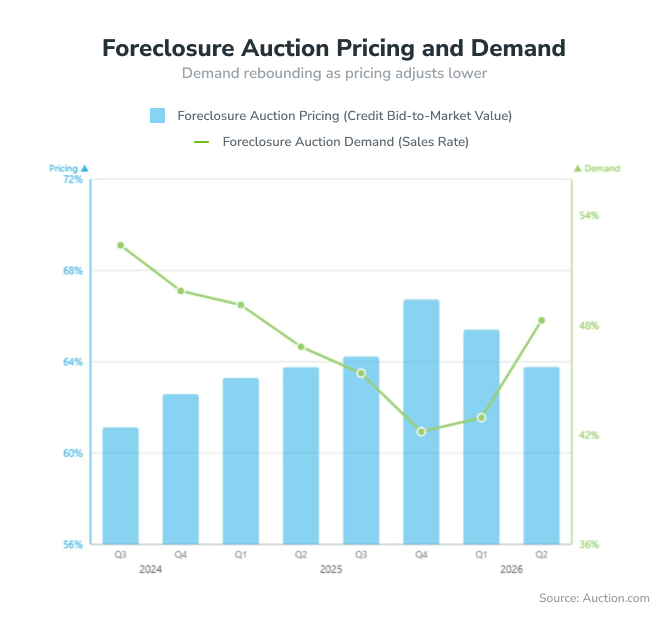
- Foreclosure auction demand jumped 12% from the previous quarter as pricing dropped 3%.
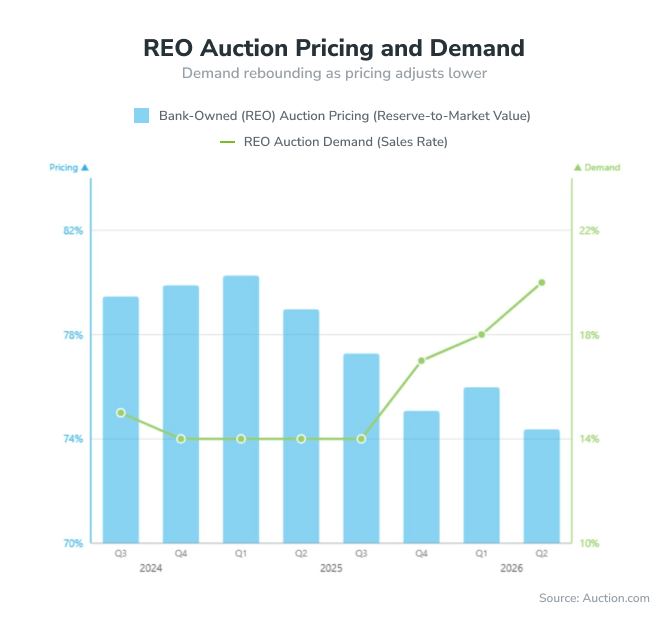
- REO auction demand jumped 43% from a year ago as pricing dropped 6%.
OVERVIEW
Distressed property auction supply in Q2 2026 continued its steady rise that began in Q1 2025, driven in large part by mortgages insured by the Federal Housing Administration (FHA) and recent vintage mortgages originated in 2022 or later — after the peak of the pandemic-triggered housing market sugar high.
Scheduled foreclosure auctions in the second quarter reached 71 percent of Q1 2020 levels, up 13 percent from a year ago to a more than six-year high. Completed foreclosure auctions reached 66 percent of Q1 2020 levels, up 23 percent from a year ago and matching the six-year high in the previous quarter. Both scheduled and completed foreclosure auction volume have now increased on an annual basis for six consecutive quarters.
Bank-owned (REO) auction volume in the second quarter was down 3 percent from the previous quarter but still up 11 percent from a year ago — the sixth consecutive quarter with an annual increase.
Distressed property auction demand improved in Q2 2026, with demand gains visible across both foreclosure and REO channels. Sales rates strengthened from the previous quarter for both auction types, while pricing alignment improved as seller pricing adjusted lower and bid-ask spreads narrowed.
DISTRESSED DEMAND
Buyer demand strengthened across both auction types in Q2 2026, buoyed by lower seller pricing (see Distressed Pricing section below). The foreclosure auction sales rate rose 12 percent from the previous quarter and 3 percent from a year earlier. That placed the foreclosure auction sales rate at 114 percent of its Q1 2020 level.
The REO auction sales rate rose 11 percent the previous quarter and 43 percent from a year earlier to a four-year high. That placed the REO auction sales rate at 95 percent of its Q1 2020 benchmark.
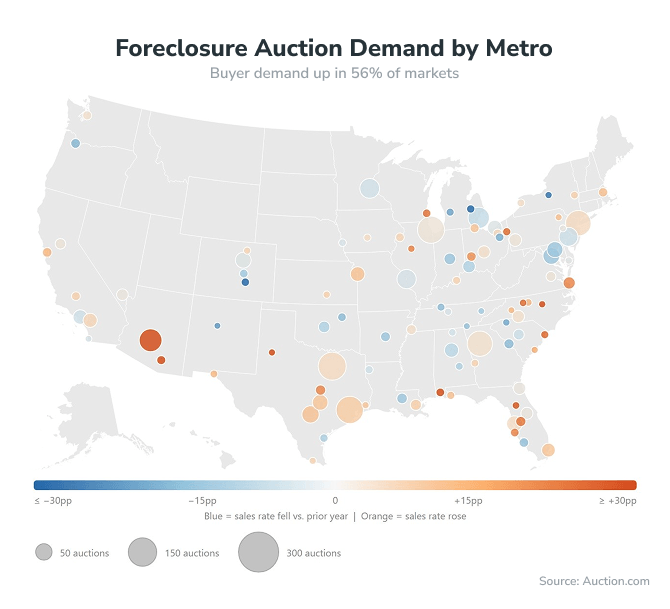
Among 99 metropolitan areas with meaningful foreclosure auction volume, 55 posted higher foreclosure sales rates year-over-year, while 43 posted declines and one was unchanged (Allentown, Pennsylvania). Improving high-volume markets included Dallas-Fort Worth, Houston, Chicago, New York, Atlanta, and Phoenix. Declining high-volume markets included Detroit, Minneapolis-St. Paul, St. Louis, Philadelphia and Washington, DC.
The highest foreclosure auction sales rates were in Boston, Milwaukee, Dayton, Ohio, Mobile, Alabama, and Virginia Beach. The lowest sales rates were in Minneapolis-St. Paul, Pueblo, Colorado, Corpus Christi, Texas, Cape Coral-Fort Myers, Florida, and Pittsburgh.
Price Demand
Despite lower seller pricing, buyer price demand held firm at foreclosure auction in Q2 2026. Foreclosure auction buyers were willing to pay an average of 66.5 percent of estimated retail market value, up from 66.2 percent in Q1 2026 and 66.0 percent in Q2 2025. That represented approximately 92 percent of the Q1 2020 foreclosure price-demand benchmark.
REO auction buyers were willing to pay an average of 65.0 percent of estimated retail market value, down slightly from 65.3 percent in Q1 2026 and 66.7 percent in Q2 2025. That represented approximately 98 percent of the Q1 2020 REO price-demand benchmark.
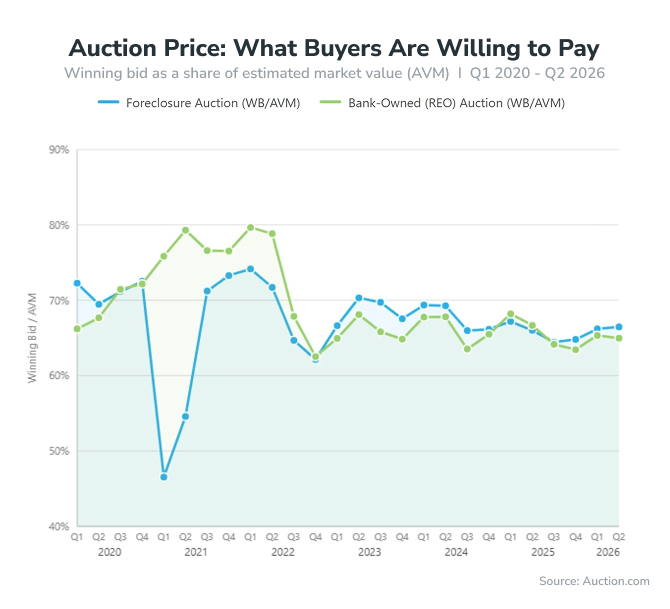
Of 99 metropolitan areas analyzed, 52 posted higher buyer price demand year-over-year, while 47 posted declines. The highest buyer price-demand markets were Tampa, New York City, Pensacola, Florida, Virginia Beach, and Omaha, Nebraska. The lowest buyer price-demand markets were Minneapolis-St. Paul, Grand Rapids, Michigan, Shreveport, Louisiana, and Wichita, Kansas.
DISTRESSED SUPPLY
Distressed supply continued its steady rise in Q2 2026. Completed foreclosure auctions, also called properties brought to auction (BTA), were at 66 percent of Q1 2020 levels, unchanged from Q1 2026 but up 23 percent from Q2 2025.
Scheduled foreclosure auctions were at 71 percent of Q1 2020 levels. Scheduled volume was up 4 percent quarter-over-quarter and 13 percent year-over-year. Both completed and scheduled foreclosure auctions have now increased on an annual basis for six consecutive quarters.
REO auction volume was at 48 percent of Q1 2020 levels. That was down 3 percent from Q1 2026 but up 11 percent from Q2 2025. REO auction volume has also now increased on an annual basis for six consecutive quarters. The share of REO auctions for vacant properties plateaued near a six-year high of 54 percent in the second quarter.
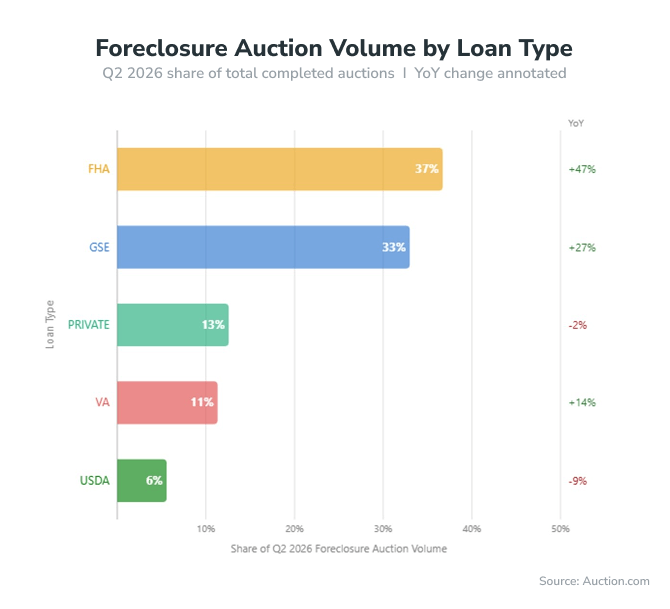
By loan type, completed foreclosure supply was led by loans insured by the FHA and U.S. Department of Veterans Affairs (VA). VA-insured loans were at 106 percent of Q1 2020 levels, up 14 percent year-over-year. FHA-insured loans were at 95 percent of Q1 2020 levels, up 47 percent year-over-year. Loans backed by the government-sponsored enterprises (GSEs) Fannie Mae and Freddie Mac were at 68 percent of Q1 2020 levels, up 27 percent year-over-year.
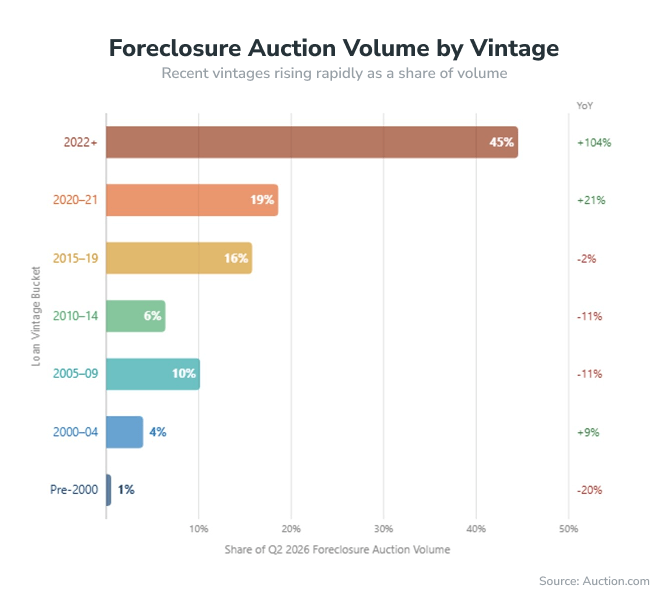
Completed foreclosure auctions on loans originated in 2022 or later accounted for 45 percent of all foreclosure auction volume in the second quarter, the highest share of any loan vintage band analyzed in the report and up 104 percent from a year ago. Loan vintages from the Great Recession years of 2005 to 2009 accounted for 10 percent of all completed foreclosure auction volume during the quarter, disproportionately high compared to surrounding loan vintages but down 11 percent from a year ago.
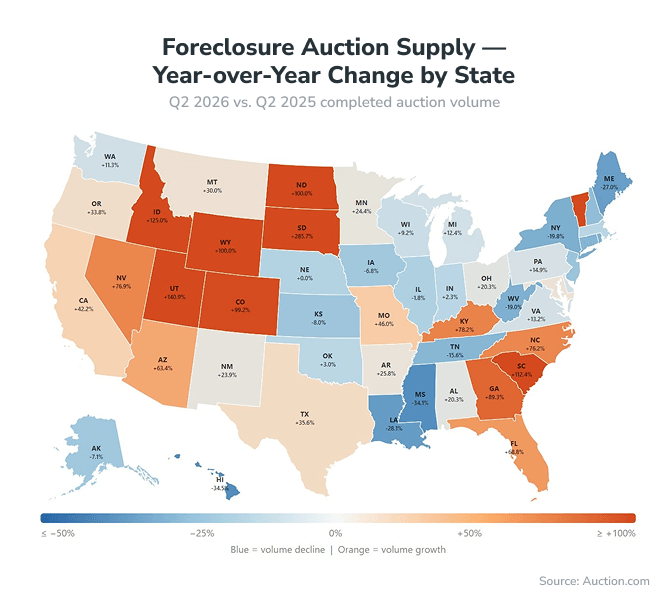
By state, 34 states reported higher completed foreclosure auction volume year-over-year, and 16 states and the District of Columbia recorded volumes above their Q1 2020 levels. The highest-volume states were Texas, Florida, Georgia, Illinois, Ohio, California, and Michigan.
Among larger-volume states, the biggest year-over-year gains were in South Carolina (up 112 percent), Colorado (up 99 percent), Georgia (up 89 percent), Kentucky (up 78 percent) and North Carolina (up 76 percent).
States with completed foreclosure auction volume above Q1 2020 levels included Texas, Arizona, Minnesota, Louisiana, and Colorado. States with volume below pre-pandemic levels included Florida, Georgia, Illinois, Ohio and California.
DISTRESSED PRICING
The average credit bid-to-market value ratio at foreclosure auction — a good pricing metric — was unchanged from a year ago but decreased 3 percent from the previous quarter and was down 4 percent from a six-year high in Q4 2025.
The average reserve-to-market value ratio at REO auction declined 2 percent from the previous quarter and was down 6 percent from a year ago. REO pricing in Q2 2026 was down 7 percent from a three-and-a-half-year high in Q1 2025.
The foreclosure auction bid-ask spread narrowed by more than 300 basis points from Q1 2026, reflecting a closer alignment between seller credit bids and buyer willingness to pay. The REO bid-ask spread also narrowed from both the previous quarter and a year earlier.
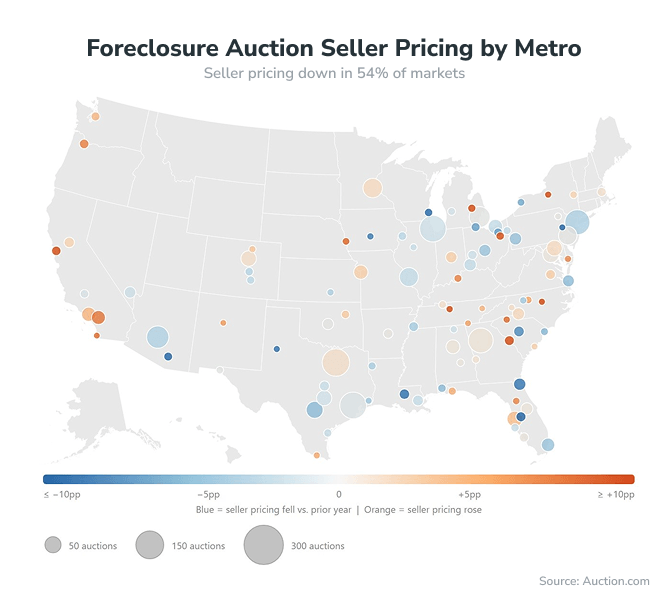
Seller pricing decreased from a year ago in 53 of the 99 metropolitan areas analyzed and was down from the previous quarter in 69 of those markets.
Markets with a quarterly decrease in seller pricing included Dallas-Fort Worth, Houston, Chicago, Atlanta, and Phoenix. Markets with a quarterly increase in seller pricing included New York, Detroit, St. Louis, Washington, D.C., and Tampa.
Markets with the lowest seller pricing at foreclosure auction in Q2 2026 were Milwaukee, Chattanooga, Tennessee, Pittsburgh, Winston-Salem, North Carolina, and Peoria, Illinois — all with average credit bid-to-value ratios of below 53 percent.
Markets with the highest seller pricing were Detroit, Cape Coral-Fort Myers, Florida, Pensacola, Florida, Tampa, and Clarksville, Tennessee — all with average credit bid-to-value ratios of above 73 percent.
MACROECONOMIC TRENDS
Rate
Probability
Index
Sentiment Index
HOUSING & MORTGAGE TRENDS
Home Sales
Prices
Mortgage Rate
Mortgage Rate