


What You’ll Learn
- The core auction demand signals sellers monitor across foreclosure and REO auctions
- What each signal measures and what it can indicate about demand conditions
- Why foreclosure and REO auction signals can diverge at the same time
- How sellers use these signals to contextualize performance conversations
Auction demand is not one metric. For servicers, banks and GSE sellers, auction demand signals are a set of marketplace measures that describe three things: buyer engagement, price alignment, and conversion from scheduled events to completed auctions. A sales rate alone can look like demand softened, but the driver may be a widening bid-ask spread, a change in roll rate that shifted the denominator, or a change in the mix of assets reaching the event.
For teams building a distressed disposition outlook, this is a definitional overview of foreclosure auction metrics (and related REO auction measures) — a practical guide on how to interpret auction demand signals in internal reporting and performance conversations.
Seller teams commonly use auction demand signals to:
- Standardize language for weekly and monthly performance reviews across default servicing, REO operations, and portfolio oversight
- Separate price alignment questions from conversion questions when sales outcomes change
- Spot engagement shifts (such as saves and bidder intensity) that can move ahead of outcomes and use them to frame the next diagnostic question
- Contextualize why foreclosure auction demand and REO auction demand can diverge in the same period without forcing one national narrative
You are often balancing timelines, compliance expectations, and portfolio risk at the same time. Clear definitions reduce debate over terminology and keep discussions focused on what can be verified.
Distressed Disposition Outlook: Auction Demand Signals at a Glance
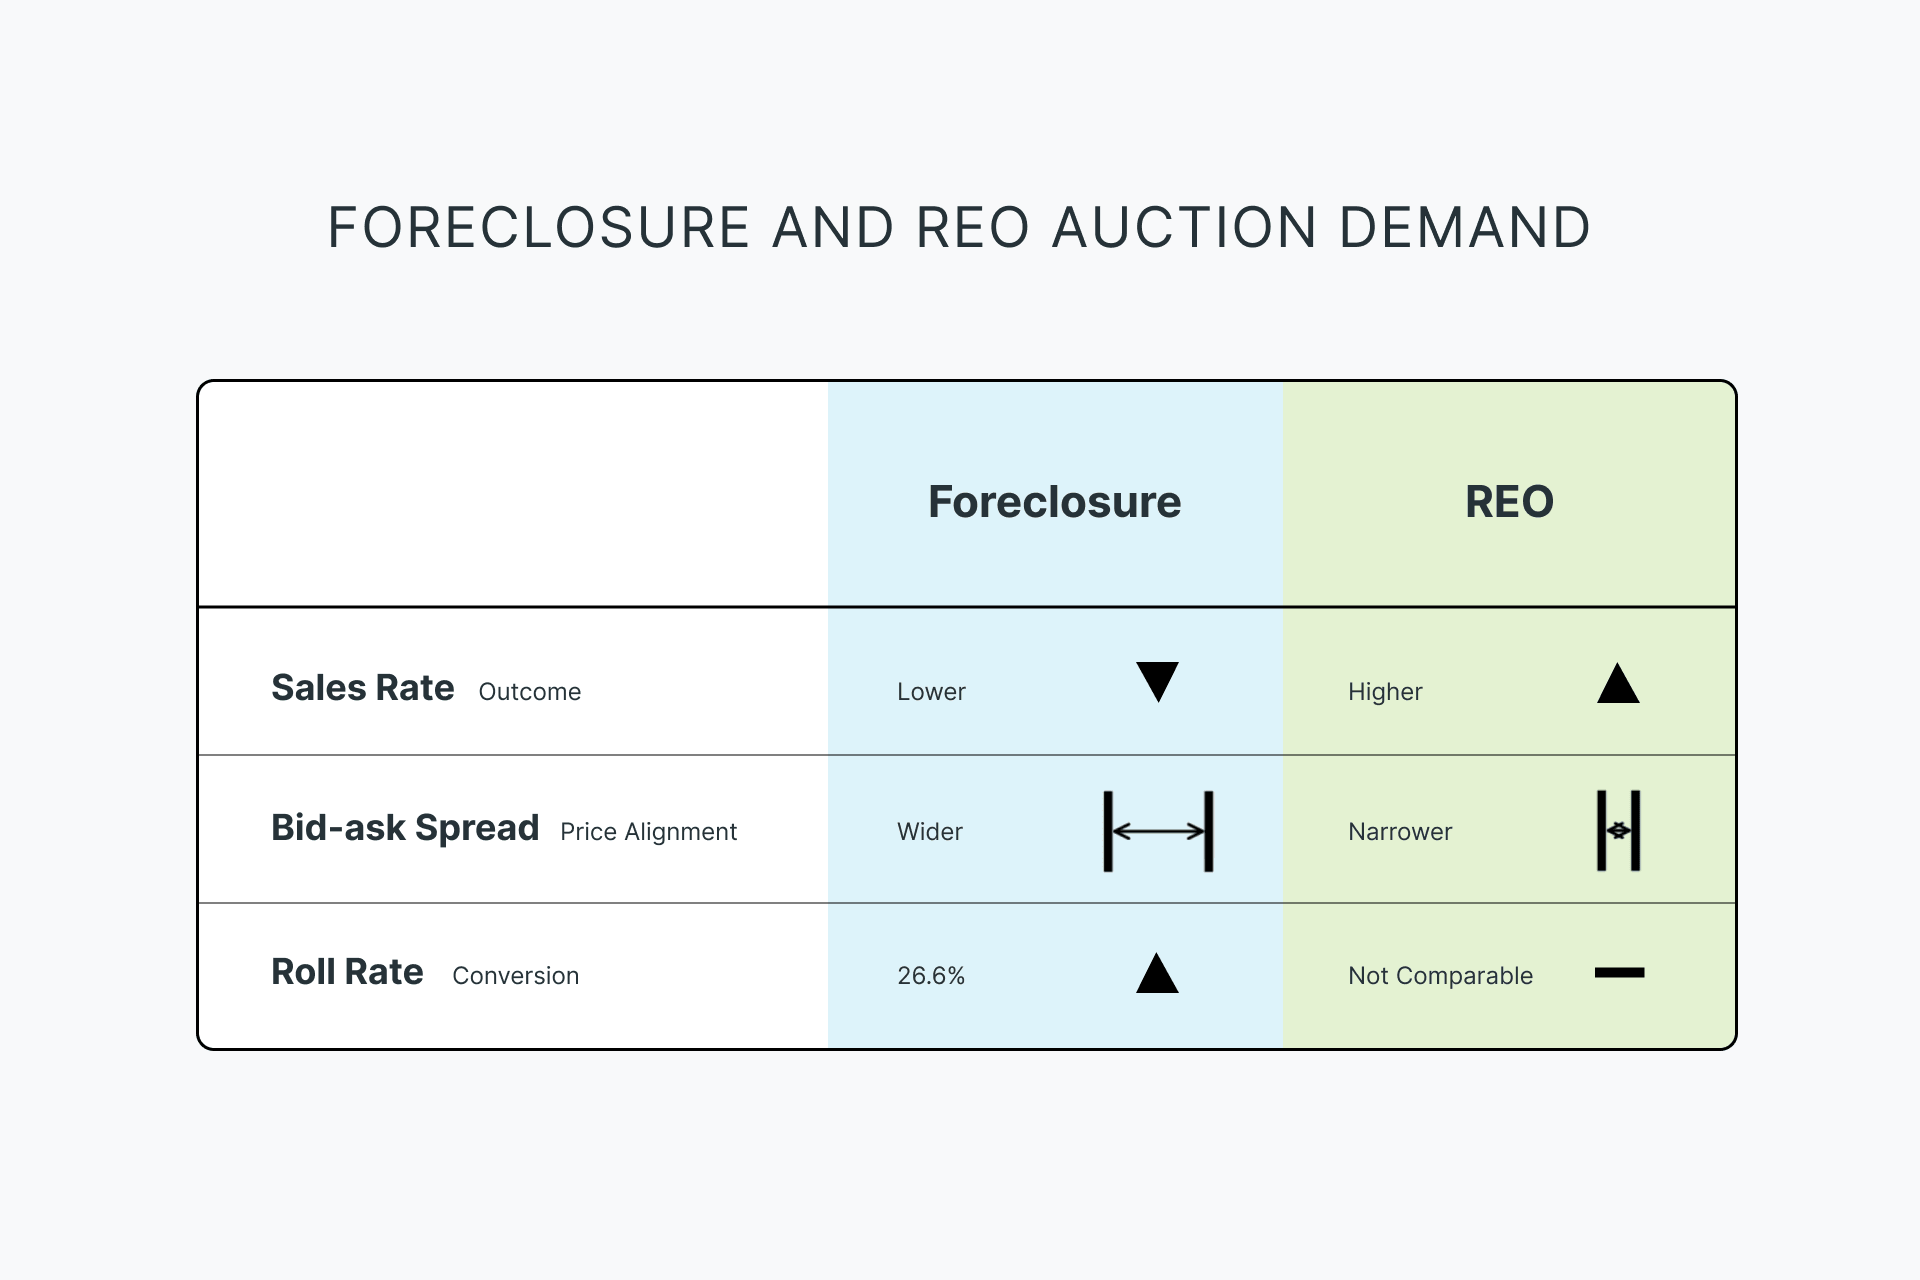
Recent Auction.com marketplace reporting (Q2 2026) shows why foreclosure auction demand is best read through multiple signals rather than a headline metric. Buyer activity strengthened, evidenced by higher sales rates across both foreclosure and REO auctions, as sellers adjusted pricing lower and bid-ask spreads narrowed.
A few examples from that reporting illustrate how signals can point different ways at the same time:
- Sales rate (outcome): Foreclosure auction sales rate rose 12% quarter-over-quarter and 3% year-over-year in Q2 2026. REO auction sales rate rose 11% quarter-over-quarter and 43% year-over-year to a four-year high.
- Price alignment (bid-ask spread): Foreclosure bid-ask spread narrowed more than 300 basis points quarter-over-quarter in Q2 2026 as seller pricing adjusted lower. REO bid-ask spread also narrowed from both the previous quarter and a year earlier as REO pricing declined.
- Conversion (roll rate): The roll rate from scheduled auction to completed foreclosure auction was 25.3% in Q2 2026, down from 26.3 percent in the previous quarter but up from 23.3 percent a year ago. The steady rise in roll rates over the past three years mean more volume of properties available at auction.
How to Interpret Auction Demand Signals: The Auction Demand Signal Stack
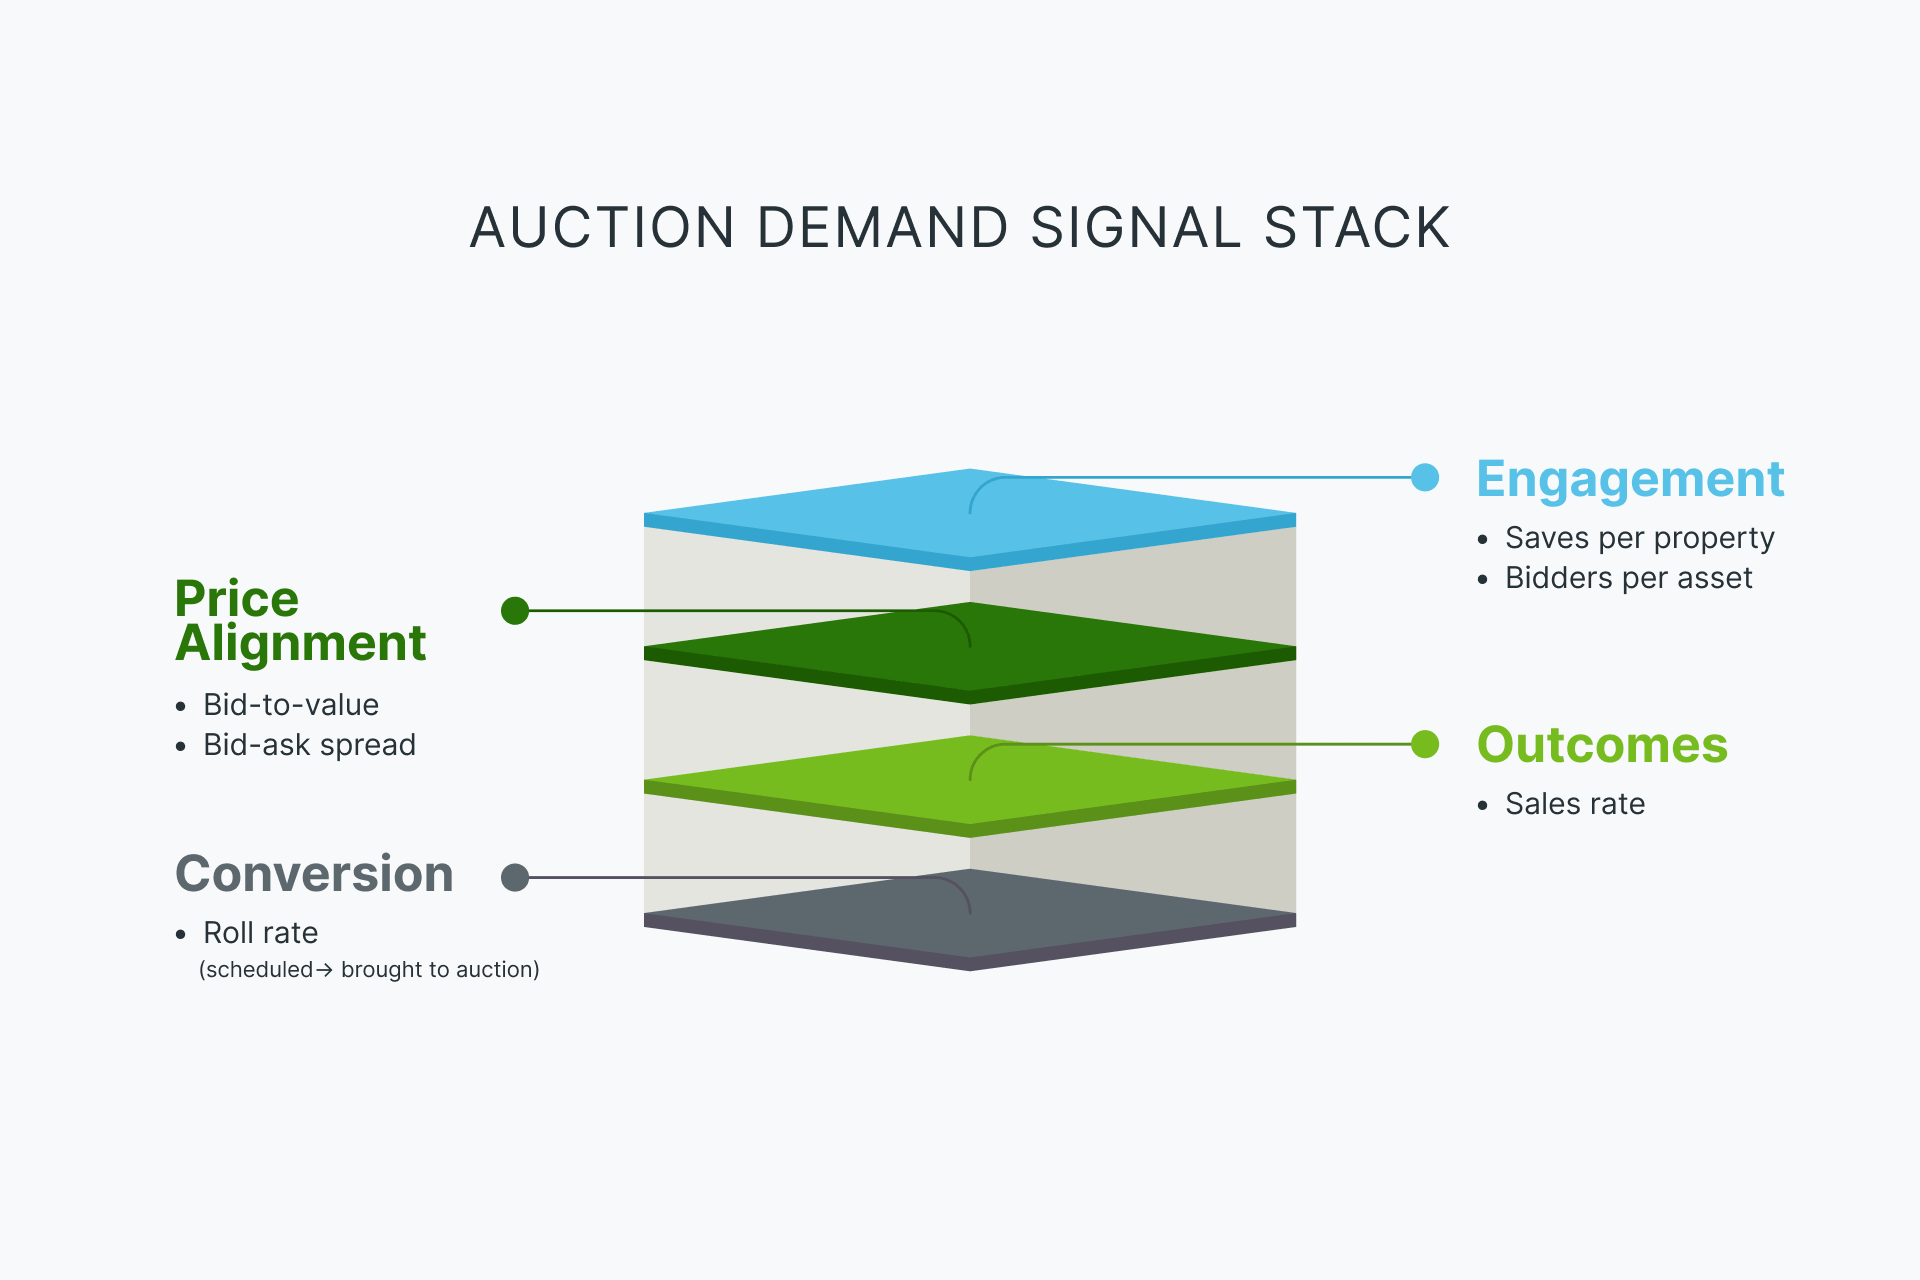
These metrics are most useful when read together. Outcome signals (sales rate) can lag. Engagement signals (saves, bidders) can lead. Price alignment signals (bid-ask spread, bid-to-value) often explain why engagement does not translate into sales.
Sales rate
What does sales rate mean at a foreclosure auction?
- Definition: The share of properties available at auction that sold to third-party buyers.
- What it can indicate: A practical proxy for buyer willingness to compete for the asset above the credit bid (the effective floor). When sales rate moves, confirm whether the change is tied to credit bid levels, conversion (roll rate) or asset mix reaching the event.
Bid-ask spread
What is bid-ask spread in auctions?
- Definition: The difference between bid and ask. In foreclosure auctions, it reflects the gap between third-party bid levels and the credit bid (the effective floor) required to transact.
- What it can indicate: A widening spread often signals greater distance between third-party bidding and the credit bid. A narrowing spread can signal improving alignment, but outcomes can still be constrained by property mix or conversion.
- Micro-scenario: If saves and bidder activity are steady but sales rate falls while spread widens, the signal is often interest without agreement rather than no demand.
Saves per property brought to auction
- Definition: The average number of online saves by prospective buyers per property brought to auction.
- What it can indicate: Directional engagement that can move ahead of outcomes. Saves signal attention and watch-listing behavior, not a commitment to bid.
Bid-to-value ratio
- Definition: A measure of how much buyers are willing to pay relative to an estimated value benchmark used in reporting.
- What it can indicate: Price sensitivity. In Q2 2026 reporting, foreclosure buyers paid an average 66.5% of estimated value, up from 66.2% in Q1 2026 and 66.0% in Q2 2025. REO buyers paid an average 65.0% of estimated value, down from 65.3% in Q1 2026 and 66.7% in Q2 2025.
Bidders per asset
- Definition: A measure of bidder intensity. How many bidders participate per asset.
- What it can indicate: Competitive depth. In Q2 2026 reporting, REO bidders per asset were flat from the previous quarter and down year-over-year even while the REO sales rate increased, illustrating that the quantity of buyer demand does not always correlate to the quality of buyer demand.
Roll rate/conversion to completed auction
- Definition: Conversion from scheduled foreclosure auctions to properties brought to auction (completed).
- What it can indicate: A denominator driver. When roll rate rises, sales rate can shift even if buyer behavior is unchanged because a different volume and mix of assets is reaching the event.
Foreclosure vs. REO Auctions: Why Demand Signals Can Diverge
Foreclosure auction demand and REO auction demand do not always move together. Divergence is not a contradiction. It is information about channel mechanics, pricing, and buyer response.
Different pricing structures, different buyer responses
Foreclosure processes vary by state and can be judicial or non-judicial, affecting timing and how inventory arrives at auction. REO refers to real estate owned after foreclosure or deed-in-lieu and is then marketed and sold through institutional disposition programs. Because the channels operate differently, pricing can move differently across them. In Q2 2026 reporting, foreclosure pricing (credit bid-to-market value) decreased 3% quarter-over-quarter and was unchanged from a year ago while REO pricing (reserve-to-market value) decreased 2% quarter-over-quarter and 6% year-over-year, with bid-ask spreads narrowing in both channels rather than diverging.
Using divergence as context, not a conclusion
Use divergence to sharpen questions, not to force a single narrative. Segment by market, occupancy, and access where possible. Then check whether roll rate changed the foreclosure denominator. If the story cannot be validated with mix or conversion context, treat it as a hypothesis, not a conclusion.
Common Misreads of Auction Demand Signals
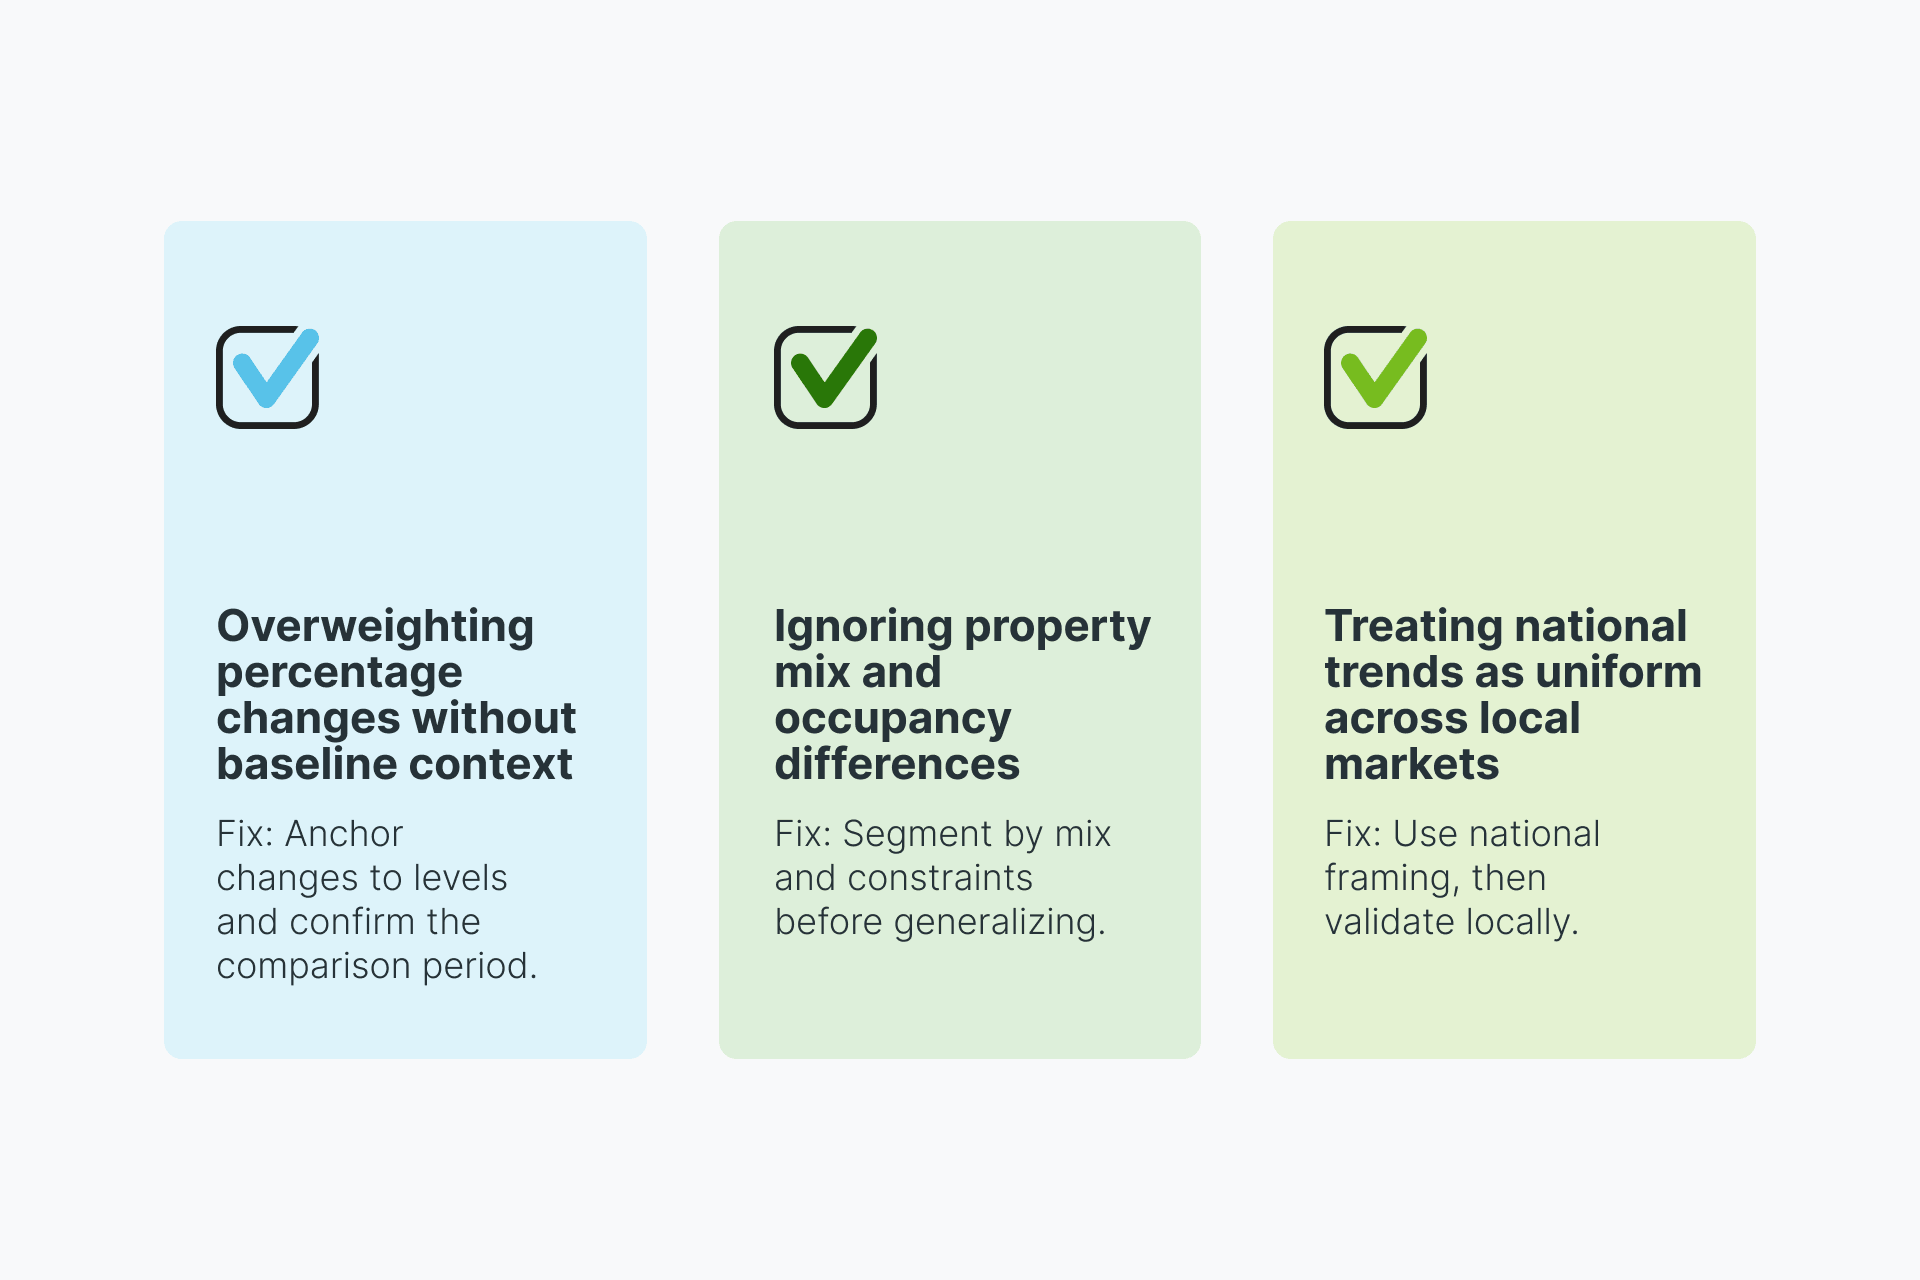
Overweighting percentage changes without baseline context
A large move off a low base can look like a demand shock when it is a normalization. Anchor on levels, not just changes, and confirm the time window being compared.
Ignoring property mix and occupancy differences
A portfolio can shift toward more complex assets without any change in buyer appetite. When sales rate changes, confirm whether the mix reaching auction changed at the same time.
Treating national trends as uniform across local markets
National reporting is useful for shared context, but execution happens locally. Use national signals to frame the conversation, then validate by market and asset segment before explaining variance.
Expert Perspective
Metrics describe what happened. Expert commentary can help teams avoid oversimplified conclusions. In a HousingWire interview, Auction.com Head of Market Economics Daren Blomquist discusses foreclosure auction trends, who buys at auction, and why current conditions should not be reduced to a 2008 comparison. That perspective complements the signal stack: interpret the metrics, then pressure-test the narrative you are tempted to tell with them.
Auction demand signals are descriptive tools. Read the stack together, compare foreclosure and REO explicitly, and segment by market and asset characteristics before drawing broad conclusions.
Key Takeaways
- Auction demand is best understood through a combination of signals, not a single metric.
- Sales rate and bid-ask spread provide insight into transaction outcomes and price alignment.
- Engagement signals such as saves and bidder intensity can move ahead of outcomes.
- Foreclosure and REO auctions can show different demand dynamics simultaneously.
- Demand signals are descriptive tools, not predictive guarantees.
For the latest benchmark context on auction demand signals, reference the most recent Auction Market Dispatch.
FAQs
What is the sales rate at a foreclosure auction?
Sales rate is the share of properties available at auction that sold to third-party buyers.
What does a widening bid-ask spread indicate?
It often indicates a growing gap between what buyers are willing to pay and what sellers are willing to accept.
What are saves per property brought to auction?
It is the average number of online saves by prospective buyers per property brought to auction, a directional engagement indicator.
How is bid-to-value calculated?
It is a price-to-value measure used in reporting that compares buyer price demand to an estimated value benchmark.
Why do foreclosure and REO auction demand signals differ?
Because the channels have different mechanics and pricing can move differently across them, spreads and sales rates can diverge in the same period.
Where can sellers find updated auction demand data?
Auction.com publishes updated benchmarks through its Auction Market Dispatch hub.