

Rural zip codes post biggest increases in bidders per asset and price per square foot for online REO auctions
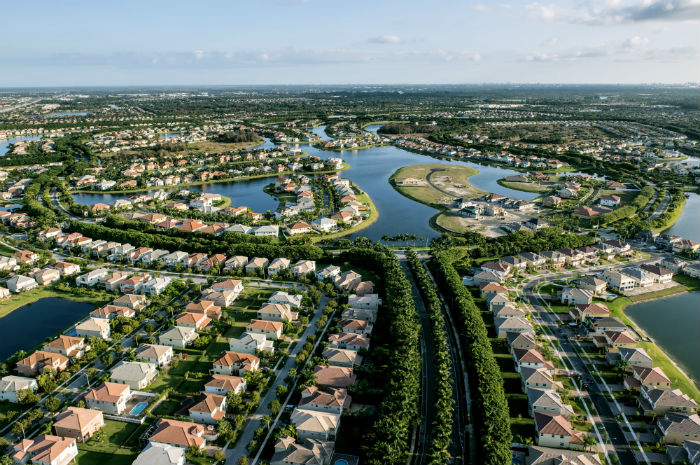
Real estate investors have quickly shifted their focus toward suburban and rural areas during the COVID-19 pandemic as homebuyers and renters migrate away from densely populated cities.
This shift can be seen in Auction.com online marketplace demand metrics data broken down by urban, suburban and rural zip codes using Census bureau classifications.
The sales rate for bank-owned properties (REO) located in suburban and rural areas both increased in the three months following the declaration of the pandemic — compared to the previous three months and compared to a year ago. The sales rate, which represents the percentage of REO properties available for auction that sold, increased 3 percent compared to a year ago for rural properties and increased 11 percent compared to a year ago for suburban properties.
That 11 percent increase in the suburban REO sales rate pushed it above the sales rate for properties located in cities. That was a reverse from the second quarter of 2019, when city properties posted a higher sales rate than suburban properties.
The average number of bidders per REO sold on the Auction.com online marketplace in Q2 2020 — another key demand metric — increased 11 percent for suburban properties and 14 percent for rural properties compared to a year ago.

Don’t Count Out Cities
That’s not to say investors have lost interest in REO properties located in urban areas. While the REO sales rate for city properties in Q2 2020 decreased 3 percent from a year ago, the average number of unique bidders per asset was up 12 percent.
Continued competition for bank-owned properties located in cities kept the price execution (price relative to seller reserve) virtually unchanged from a year ago while the average price per square foot decreased by less than 1 percent compared to a year ago.
Strongest Price Gains for Rural REOs
Meanwhile increasing demand for suburban and rural properties pushed the average price per square foot up compared to a year ago for REO properties in those areas. The average price per square foot in suburban areas increased 2 percent from a year ago while the average price per square foot in rural areas increased 8 percent from a year ago.

Those distressed property price appreciation numbers parallel price appreciation in the retail market, according to an Auction.com analysis of public record sales data from ATTOM Data Solutions, broken down by the Census bureau classifications of city, suburban and rural zip codes.
That analysis shows average retail home prices for existing homes located in cities increased 4 percent in the second quarter compared to a year ago, while average home prices increased 5 percent for properties located in suburbs and 11 percent for properties located in rural areas.

Stronger home price appreciation in the suburbs compared to the cities is not new for 2020 in the retail market. Suburban properties posted stronger annual price appreciation than urban properties in the second quarters of 2019 and 2018.
But the strength in rural areas is a newer phenomenon, with price appreciation in rural areas narrowly edging out price appreciation in suburban areas a year ago before accelerating to more than twice the pace of both suburban and urban price appreciation this year.
It’s important to note that the bulk of the rural home sales are occurring in the Census subtype of “Rural-Fringe”, defined as a “Census-defined rural territory that is less than or equal to 5 miles from an urbanized area, as well as rural territory that is less than or equal to 2.5 miles from an urban cluster.” That indicates most of the rural sales are occurring within five miles of an urbanized area.
Acceleration of a Longer-Term Trend
The strength of rural home prices has likely been accelerated by the pandemic, which has motivated and allowed many to move away from more densely populated areas. But that rural market strength is also grounded in a longer-term population shift away from high-priced and high-tax cities on the coasts and toward the lower prices and lower taxes often available in the interior of the country.
County-level population migration data from the U.S. Census Bureau shows that the five counties posting the biggest net migration decreases in 2019 were all located in the nation’s three largest cities: New York, Los Angeles and Chicago. Those top five counties were Los Angeles County, California (down 79,758), Cook County, Illinois (down 41,173), Kings County, New York (down 37,742), Queens County, New York (down 31,906) and Bronx County, New York (down 22,506).
Conversely, the five counties posting the biggest net migration increases in 2019 were all located in metro areas known for low-density housing and suburban sprawl: Phoenix, Las Vegas, Dallas and Austin. Those top five counties were Maricopa County, Arizona (up 62,997), Clark County, Nevada (up 31,283), Collin County, Texas (up 24,052), Denton County, Texas (up 22,716), and Williamson County, Texas (up 20,312). Three Florida counties were in the top 10 counties for biggest net migration increases in 2019: Polk County (Lakeland in central Florida ), Lee County (Fort Myers) and Pasco County (Tampa).
Outside of Arizona, Nevada, Texas and Florida, other counties with a net migration inflow of at least 100 people per week in 2019 included Wake County, North Carolina (Raleigh), Riverside County, California (Inland Empire of Southern California), King County, Washington (Seattle), Ada County, Idaho (Boise), and Horry County, South Carolina (Myrtle Beach).
